Help
In the Home page, you can use the "Search" button to find specific introns by gene name, gene ID, transcript ID and cancer type. Examples for each keyword option are provided, including ENSG00000107902.14, FLT4, ENST00000370002.8, and LUAD, which are the gene ID, gene name, transcript ID, and cancer type, respectively.
Advanced search is available by clicking the "Advanced" button. It allows users to combine keywords with operators such as “AND,” “OR,” and “NOT” to query IR-encoded microprotein data accurately. An example query like “Gene name = STN1 AND Cancer type = CRC” is available by clicking the “Example” button.
The "Search results" are organized in tabular format with columns for iORF ID, gene ID, gene name, gene type, coding probability, and cancer type. The iORF ID represents introns located at different positions on the chromosome. Coding probability indicates the likelihood that an intron encodes a protein, as predicted by the CPAT (Coding Potential Assessment Tool). Cancer type denotes the presence of protein profile evidence for IR-encoded microproteins in various cancers. Users can click the "Download" button to get the data in txt format. Explanation of the columns are shown by clicking the icon. The "Detailed information" page is displayed by clicking any "iORF ID" or the icon.
The "Detailed information" page consists of four parts: "Intron information", "Coding potential", "Subcellular location" and "Structure".
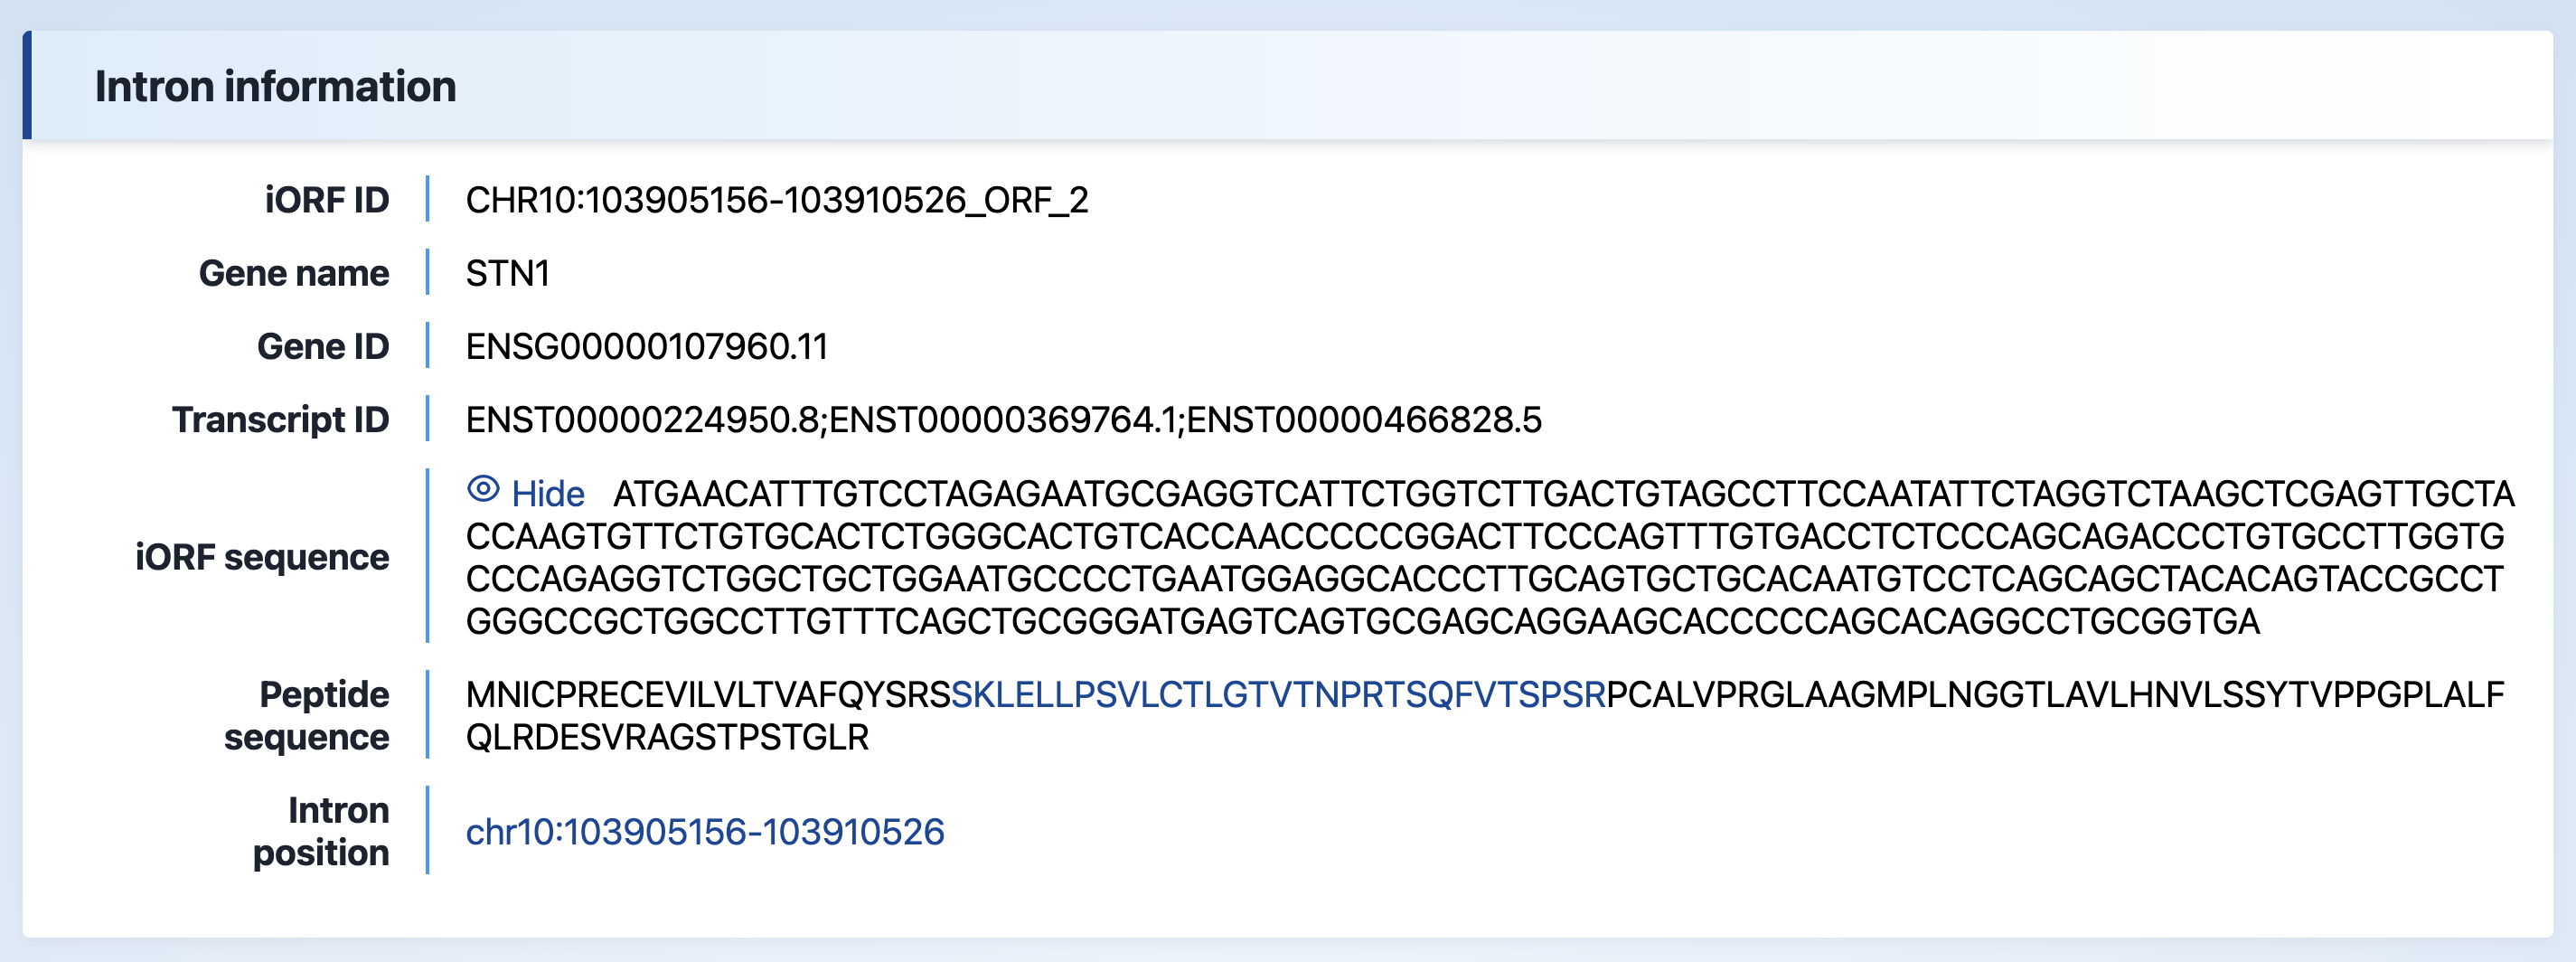
(1) Intron information
The basic information of the intron, including the iORF sequence, peptide sequence, and intron position. The database also provides an external link to Ensembl for further information on intron location.
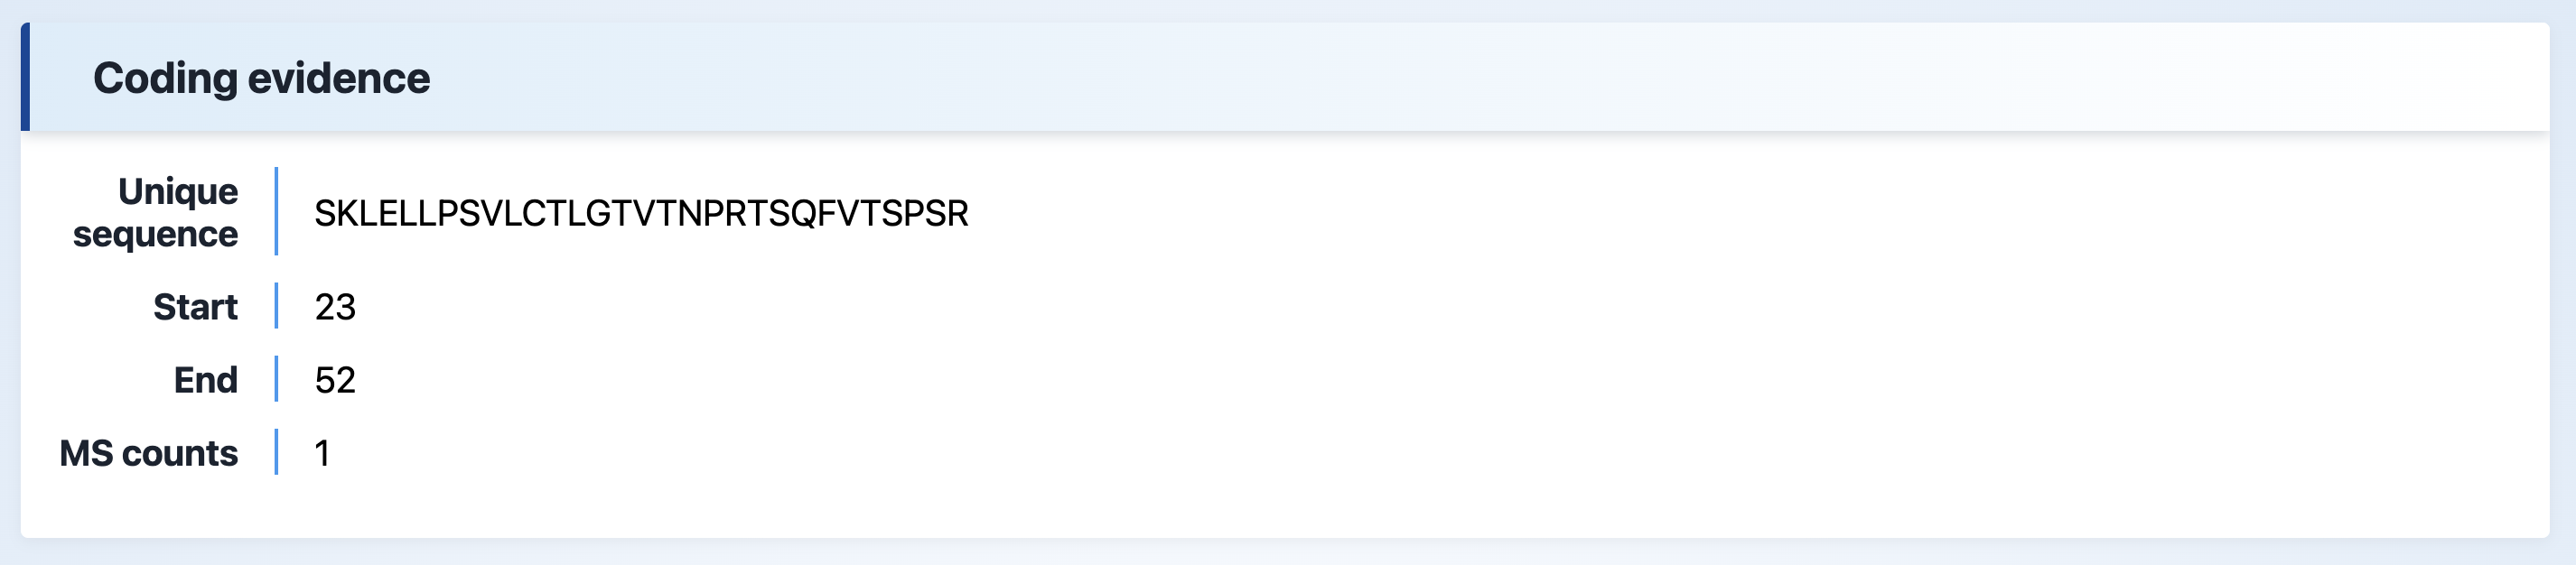
(2) Coding evidence
This section shows MS evidence for peptides encoded by IR. It includes the start and end positions of the intron, the number of MS counts, and the unique sequence.
(3) Subcellular location
The subcellular localization information of the protein.
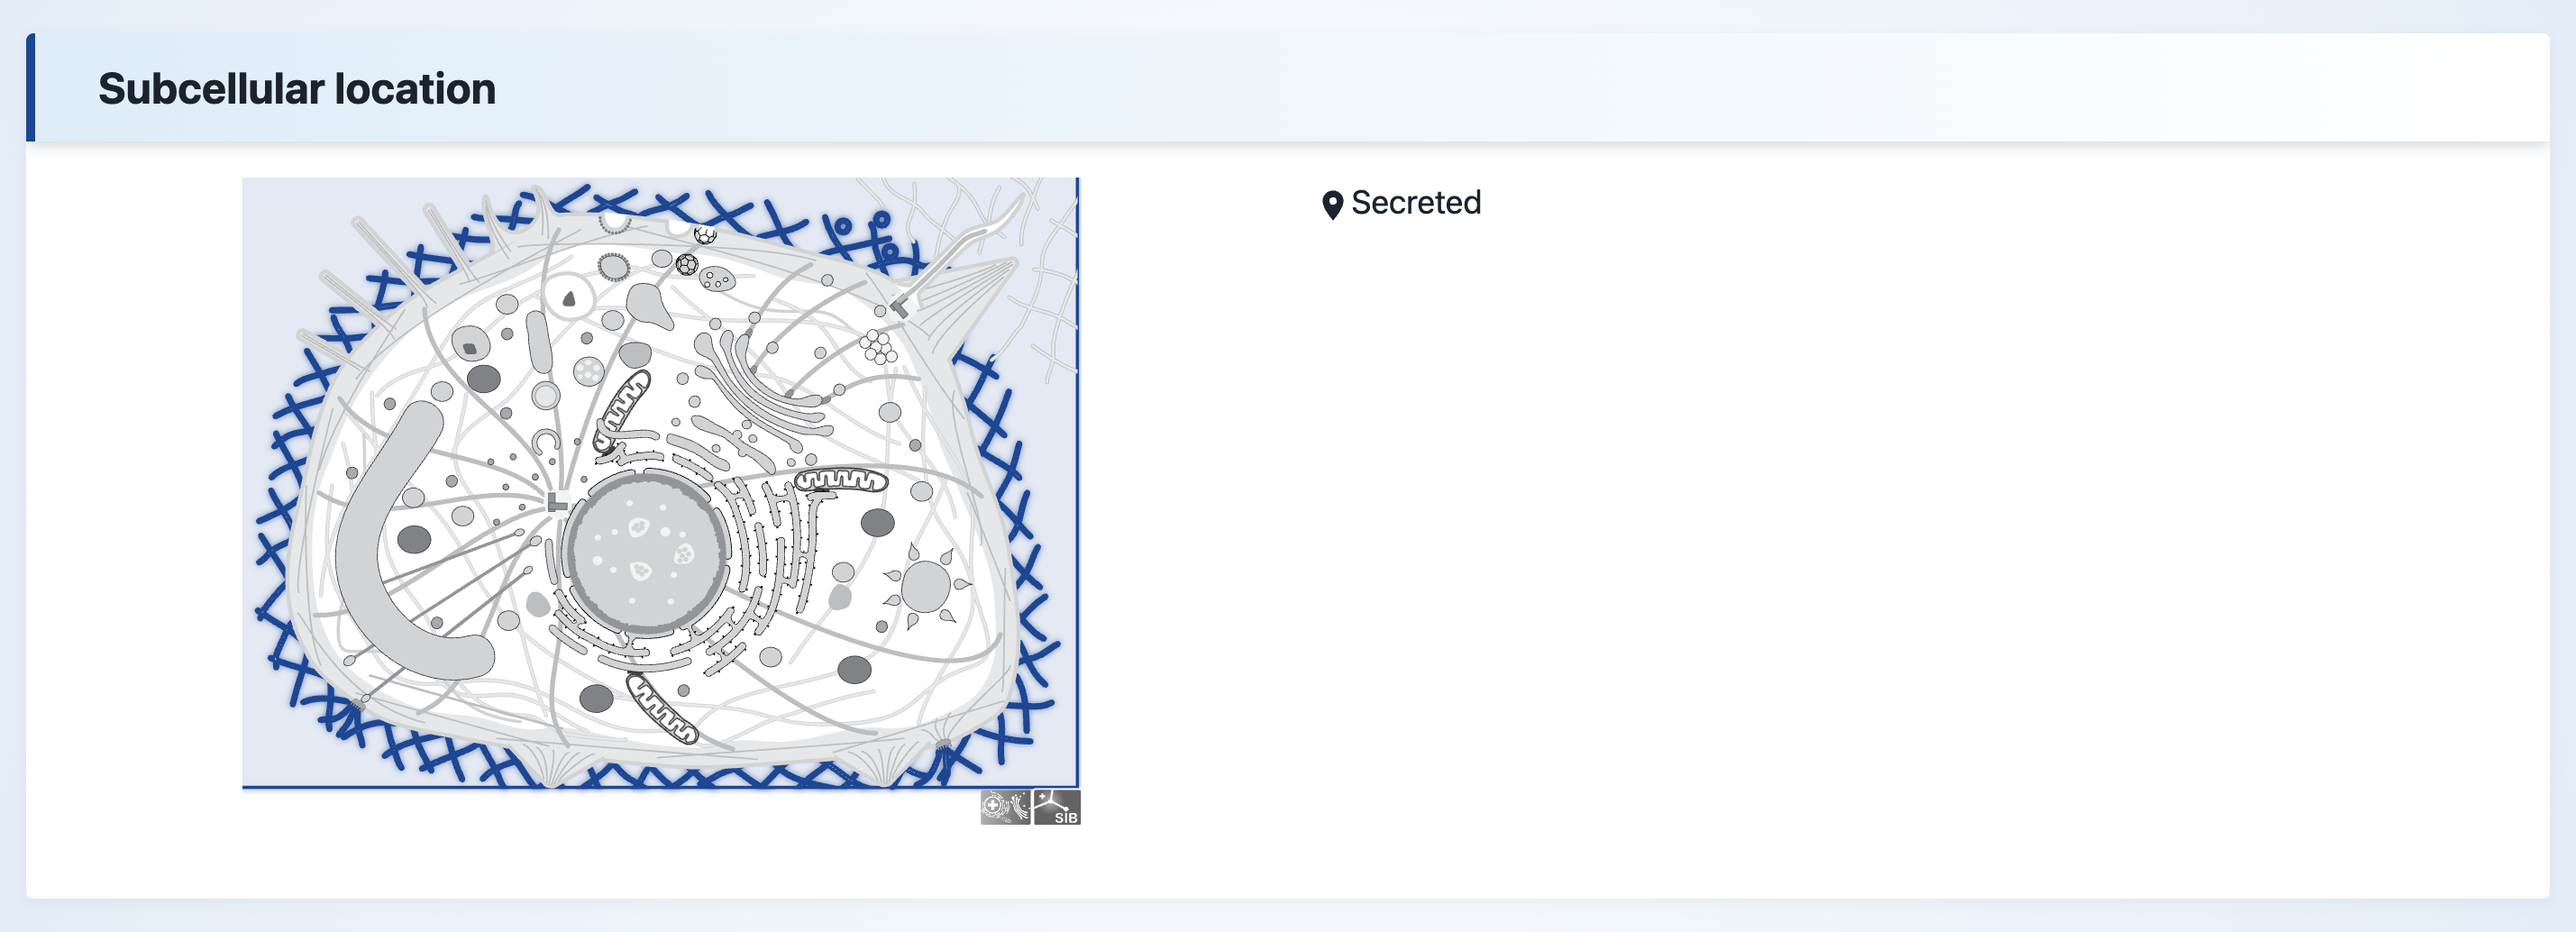
Explanation:
Subcellular location- The subcellular location information was predicted by MULcDeep.
(4) Structure
The PTM information, second structure, surface accessibility, and 3D structure can be visualized in the “Structures” section.
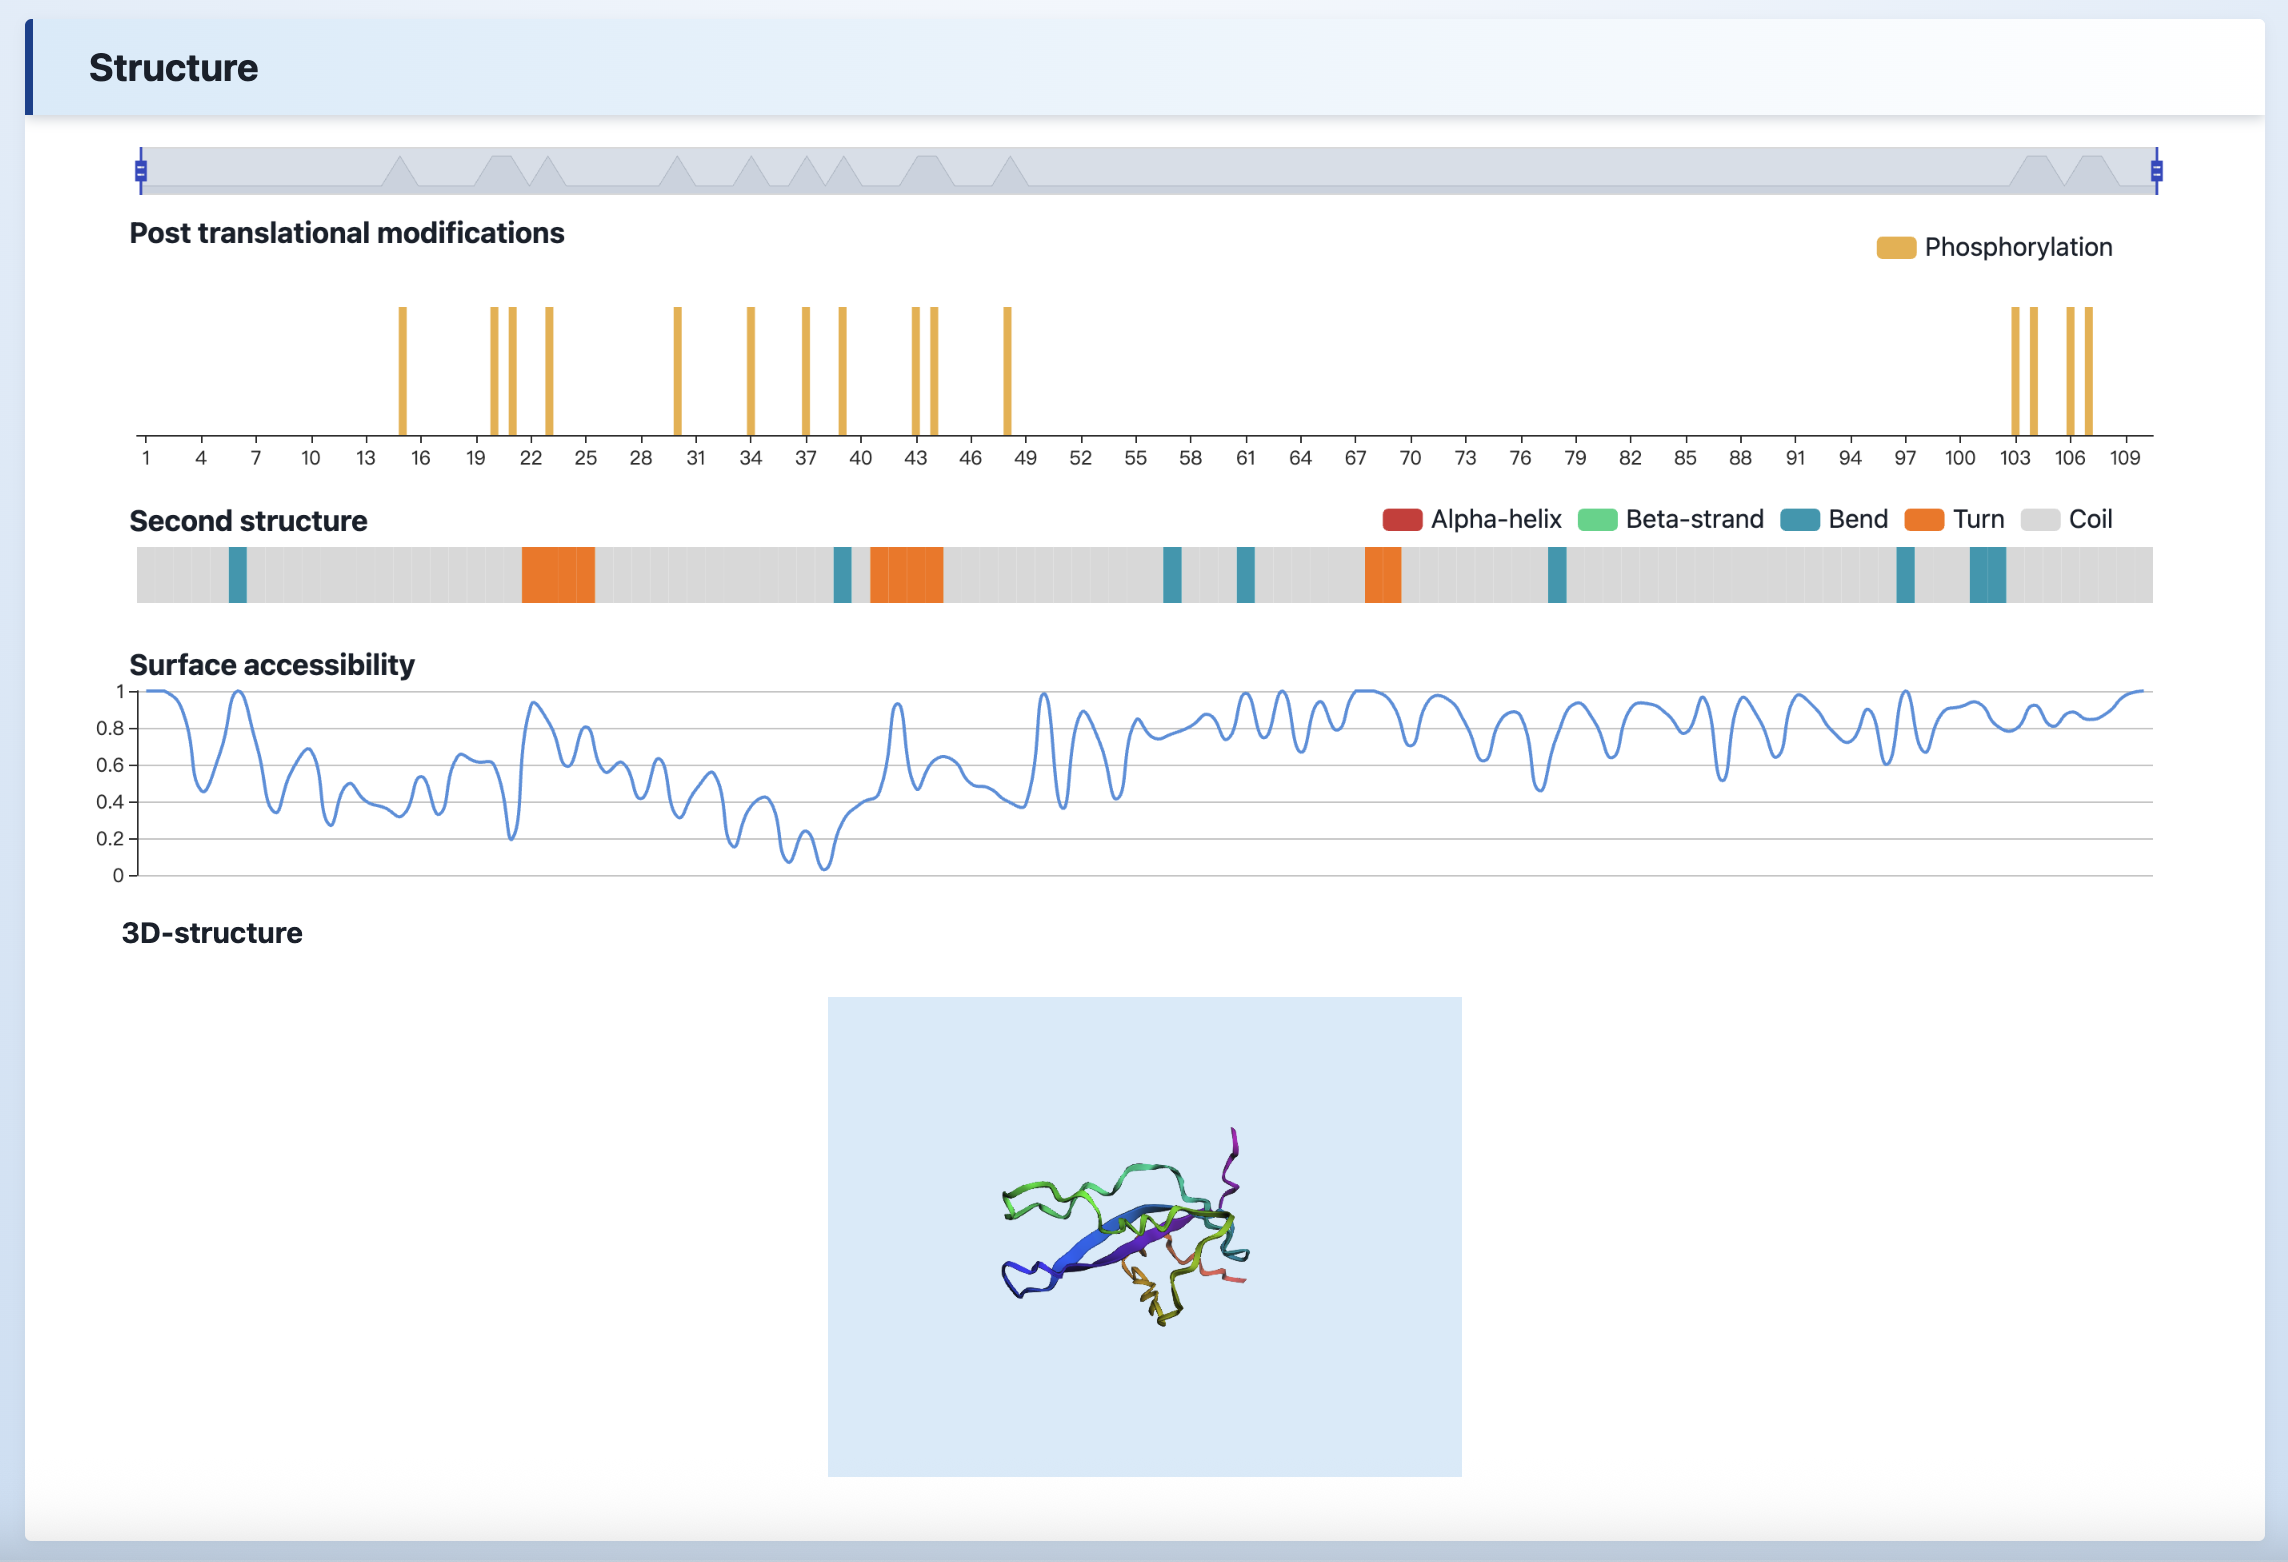
Explanation:
Post translational modifications- The post translational modifications information was collected from qPTM database.Surface accessibility, Second structure- The surface accessibility values were predicted by NetSurfP.3D-structure- The 3D-structure of the protein retrived from PDB database.
iMPI data are available for download. Please fill in the form below, the iMPI dataset file will be sent to your email address. Please note that the dataset file is only available for academic research. If for commercial usage, please contact us.